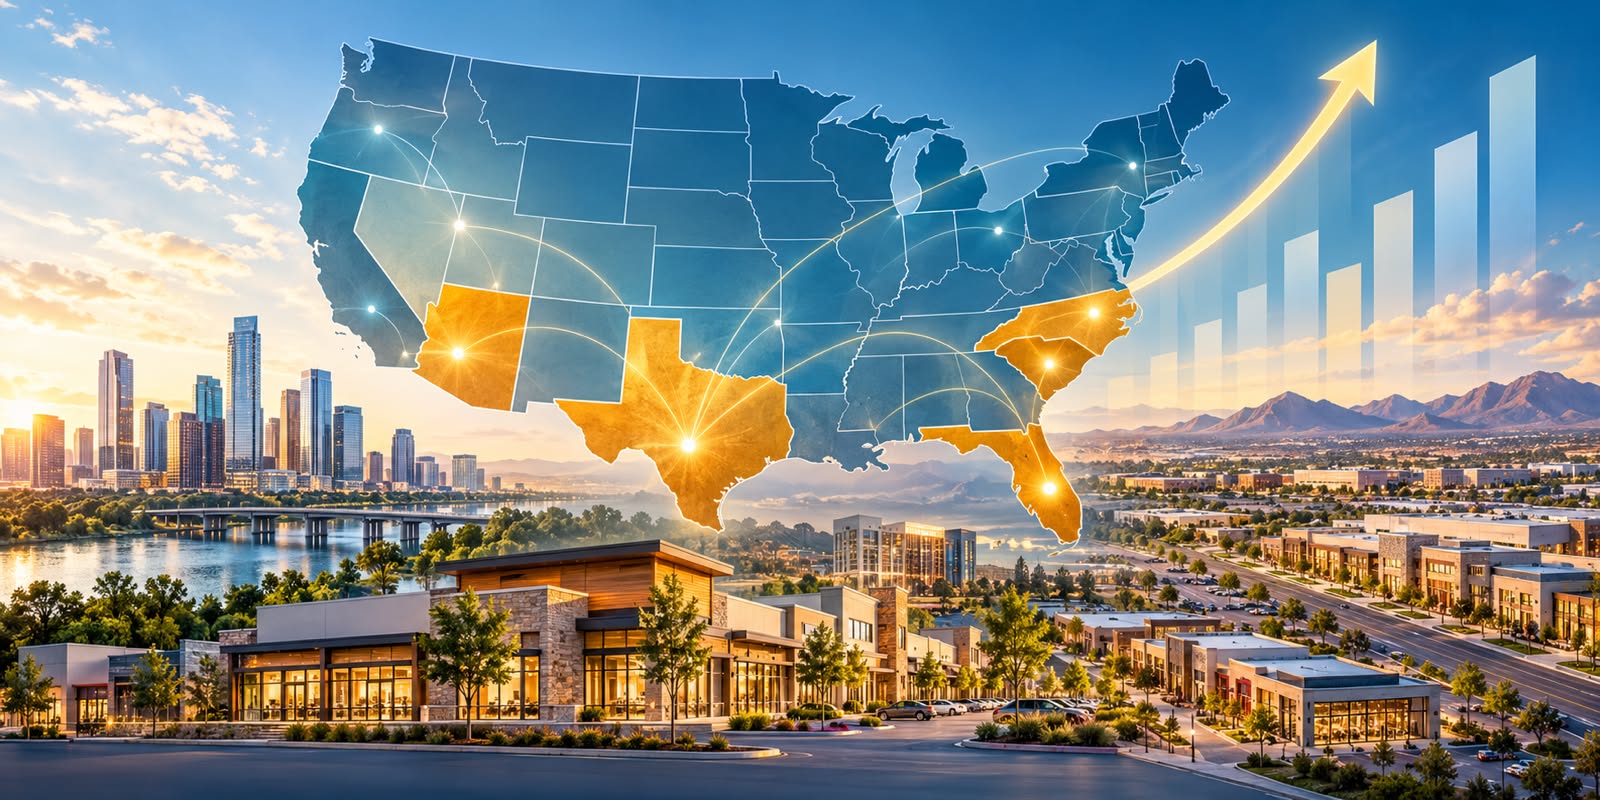
The fastest growing states 2026 are concentrated in the South and Mountain West. Texas, Florida, South Carolina, Arizona, and North Carolina lead on economic output, population, and business formation. The harder question for the decade ahead is which of them can sustain that growth through 2036, as national population growth slows and immigration becomes less predictable.
The best current evidence points to states that combine scale, affordable land, business relocation, and a diversified economy. Those are also the places where new households keep creating demand for grocery stores, restaurants, medical offices, and the retail land that serves them.
This article separates data describing 2026 from projections extending to 2036. It then connects both to what commercial land and retail investors should evaluate before committing to a growth market.
Which States Grew Fastest Between 2021 and 2025?
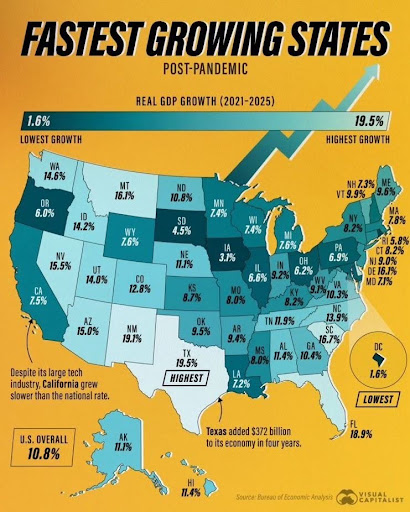
Real GDP growth by state, 2021 to 2025. Source: Bureau of Economic Analysis, via Visual Capitalist (June 2026).
Texas posted the strongest economic growth of any state between 2021 and 2025. Its real GDP expanded 19.5 percent and added roughly $372 billion in output, according to Bureau of Economic Analysis data compiled by Visual Capitalist in June 2026. The national economy grew 10.8 percent over the same four years, and only 18 states beat that average.
This chart measures real GDP, which is total economic output adjusted for inflation. It is a measure of economic growth, not population growth, and the two do not always move together. New Mexico ranked second on output at 19.1 percent, driven largely by energy production, yet its population shrank slightly in 2025.
| Rank | State | Real GDP growth, 2021 to 2025 |
| 1 | Texas | 19.5% |
| 2 | New Mexico | 19.1% |
| 3 | Florida | 18.9% |
| 4 | South Carolina | 16.7% |
| 5 | Montana | 16.1% |
| 6 | Delaware | 16.1% |
| 7 | Nevada | 15.5% |
| 8 | Arizona | 15.0% |
| 9 | Washington | 14.6% |
| 10 | Idaho | 14.2% |
| 11 | Utah | 14.0% |
| 12 | North Carolina | 13.9% |
| 20 | Georgia | 10.4% |
| 38 | California | 7.5% |
| Benchmark | United States | 10.8% |
Source: Bureau of Economic Analysis, real GDP by state, 2021 to 2025, via Visual Capitalist (June 2026).
Population tells a related but different story. Texas added 391,243 residents between July 2024 and July 2025, the largest numeric gain in the country, per U.S. Census Bureau Vintage 2025 estimates. Florida followed with 196,980, and North Carolina with 145,907, as summarized by the National Association of Home Builders in February 2026. By percentage, South Carolina grew fastest at 1.46 percent, followed by Idaho, North Carolina, Texas, and Utah, according to The Pew Charitable Trusts (May 2026).
Seven states appear near the top of both lists: Texas, Florida, South Carolina, North Carolina, Arizona, Idaho, and Utah. They hold the most durable claim to the label fastest growing states 2026. Georgia grew more slowly in output but remains one of the largest numeric population gainers in the Southeast.
What Is Driving Growth in the Leading States?
The leading states share a repeatable formula. People and companies move in, new businesses form, large capital projects follow, and land and housing stay affordable enough to keep the cycle going. Camoin Associates’ 2026 state economic momentum ranking (July 2026) scores population, employment, output, business formation, tax structure, and announced capital investment over five years. It places Texas first, followed by Arizona, Florida, North Carolina, Tennessee, Georgia, South Carolina, Utah, Nevada, and Idaho.
Five drivers stand out across that group:
- Domestic migration from high-cost states. Texas added more than 2.5 million residents between 2020 and 2025, per Visual Capitalist’s analysis of Census data. Florida added more than 1.9 million and North Carolina more than 750,000. Each new household needs housing, groceries, services, and healthcare close to home.
- Business formation and relocation. Texas recorded nearly 500,000 new business applications in 2024 and leads the nation in headquarters relocations, according to Camoin Associates (2026). Utah posted the highest business formation score in the model. Job creation follows the same map: the Dallas Fed expects Texas to add about 173,600 jobs in 2026, and Camoin reports Nevada’s workforce grew 1.9 percent in the year to April 2026 against 0.2 percent nationally.
- Anchor capital investment. Camoin Associates (2026) cites TSMC’s $165 billion semiconductor buildout in Arizona and Micron’s roughly $25 billion expansion in Idaho. South Carolina has landed more than $50 billion in capital investment since 2018. Projects of this size pull suppliers, workers, and retail demand into surrounding submarkets.
- Affordable land and housing supply. The South and West accounted for 79 percent of single-family housing starts in 2025 while holding about 63 percent of the population. That figure comes from U.S. Census Bureau construction data cited by Visual Capitalist (October 2026). Rooftops arrive first; retail follows.
- Economic diversification. Texas draws on energy, technology, manufacturing, finance, healthcare, and logistics. Arizona pairs semiconductors with aerospace and defense. Georgia combines logistics, film, finance, and electric vehicle manufacturing. Diversified states are less exposed to a single industry downturn.
These drivers reinforce each other. A relocating employer attracts workers, and workers form households. Households support retail and services, and the resulting tax base funds the roads and utilities that make the next tract of land developable.
Can the Fastest Growing States 2026 Hold Their Pace to 2036?
The evidence suggests the leaders will keep growing, but at a slower rate and against a weaker national backdrop. No official body projects state GDP ten years out. The decade view therefore rests on three sources: national economic forecasts, state population projections, and the long-term migration trends behind them.
- The national ceiling is lower. The Congressional Budget Office projects real GDP growth of 2.2 percent in 2026, slowing to an average of 1.8 percent a year from 2027 to 2036. The figures come from its Budget and Economic Outlook: 2026 to 2036 (February 2026). CBO attributes the slowdown partly to slow labor force growth as the population ages, offset by productivity gains from artificial intelligence.
- Population growth is decelerating everywhere. The University of Virginia’s Weldon Cooper Center projects the U.S. population rising from 331 million in 2020 to 352 million in 2030 and about 370 million by 2050. Growth slows each decade in its July 2026 national and state projections. The South’s share of the population is projected to climb from about 38 percent in 2020 to nearly 43 percent in 2050.
The same projections, which assume recent trends continue, show how uneven the 2030s could be. The table below uses the 2030 to 2040 decade as the closest available proxy for 2026 to 2036.
| State | Projected 2030 population | Projected 2040 population | Change, 2030 to 2040 |
| Texas | 34.2 million | 38.3 million | +4.1 million (+12.0%) |
| Florida | 25.2 million | 28.1 million | +2.8 million (+11.2%) |
| North Carolina | 11.9 million | 12.7 million | +0.8 million (+6.9%) |
| Georgia | 11.9 million | 12.6 million | +0.7 million (+6.1%) |
| Arizona | 8.1 million | 8.7 million | +0.6 million (+7.6%) |
| Utah | 3.8 million | 4.3 million | +0.5 million (+13.2%) |
| Idaho | 2.2 million | 2.5 million | +0.3 million (+14.0%) |
| South Carolina | 6.0 million | 6.5 million | +0.5 million (+8.5%) |
| California | 39.6 million | 39.2 million | -0.4 million (-1.0%) |
| New York | 20.0 million | 19.5 million | -0.5 million (-2.3%) |
| Illinois | 12.7 million | 12.1 million | -0.6 million (-4.7%) |
Source: Weldon Cooper Center for Public Service, University of Virginia, national and state population projections (July 2026). Percentages calculated from the published state totals.
Two observations matter for investors. First, Texas and Florida are projected to add more residents in the 2030s than the next five growth states combined. That is a question of scale rather than speed. Second, Idaho and Utah are projected to grow faster in percentage terms but from much smaller bases, which means less absolute retail demand each year.
Migration is the swing factor. Pew’s analysis of Census data (May 2026) found population growth slowed in 44 states in 2025 as net international migration fell sharply. CBO expects the national rate of natural change (births minus deaths) to turn negative around 2030. That makes every state more dependent on migration for growth. States with young, working-age populations, such as Texas and Utah, are better positioned than aging states in the Northeast and Midwest.
How Texas Economic Growth Compares With Other High-Growth States
Texas is the only state that ranks at or near the top on economic output, numeric population growth, business formation, and sheer size at once. That combination, more than any single growth rate, is what distinguishes Texas economic growth from the rest of the field.
The Texas economy reached $2.9 trillion in current-dollar GDP in 2025 and grew 2.5 percent after inflation, faster than the nation. Those are preliminary Bureau of Economic Analysis estimates reported by the Office of the Texas Governor (April 2026). That output would rank eighth among the world’s national economies. Over the 15 years ending in 2025, Texas added population at a compound rate of 1.53 percent a year. Only Idaho and Utah grew faster, per Pew (May 2026).
The near-term picture is steadier than the post-pandemic surge. The Federal Reserve Bank of Dallas forecasts Texas jobs will grow 1.2 percent in 2026, adding about 173,600 positions, in its Texas Employment Forecast (September 2026). Year-to-date growth of 1.0 percent through August is below the state’s long-run average of 2 percent. Texas is normalizing, not stalling.
| State | Real GDP growth, 2021 to 2025 (BEA) | Population growth, 2024 to 2025 (Census) | Camoin momentum rank, 2026 | Projected population change, 2030 to 2040 (Weldon Cooper) |
| Texas | 19.5% | +391,243 (1.25%) | 1 | +4.1 million (+12.0%) |
| Florida | 18.9% | +196,980 (0.8%) | 3 | +2.8 million (+11.2%) |
| Arizona | 15.0% | top 10 by rate | 2 | +0.6 million (+7.6%) |
| North Carolina | 13.9% | +145,907 (1.32%) | 4 | +0.8 million (+6.9%) |
| Georgia | 10.4% | not in top 10 by rate | 6 | +0.7 million (+6.1%) |
Sources: Bureau of Economic Analysis via Visual Capitalist (June 2026); U.S. Census Bureau Vintage 2025 estimates via NAHB and Pew (2026); Camoin Associates (July 2026); Weldon Cooper Center (July 2026).
Florida matches Texas on output growth and is projected to add a similar share of residents. Its recent growth, however, has leaned heavily on international migration, which Pew notes slowed sharply in 2025. North Carolina attracted more net domestic migrants than Texas in 2025 and is well diversified across banking, biotech, and research. It operates at roughly a third of Texas’s population. Arizona carries the highest announced capital investment score in Camoin’s model, concentrated in the Phoenix semiconductor cluster, which makes its growth more geographically concentrated.
For a commercial land investor, the practical difference is depth. A large, diversified state can absorb a slowdown in one industry or one migration channel and keep generating household growth across dozens of submarkets. A smaller or more specialized state can grow faster on paper while offering fewer places to deploy capital safely.
Which Growth Signals Point to Retail Development Demand?
Retail demand follows households, and the strongest signal in 2026 is that new households are arriving faster than new retail space is being built. CBRE’s U.S. Real Estate Market Outlook Midyear Review (2026) reports retail availability at 4.9 percent in the second quarter. Only 11 million square feet were completed over the trailing four quarters, against a historical average of roughly 18 million. Dallas, Phoenix, and Houston led the nation in net absorption. Expanding brands are favoring new construction in Sun Belt suburbs over older downtown space.
That supply gap is expected to persist. CBRE forecasts supply growth of just 0.24 to 0.26 percent a year for neighborhood, community, and strip centers. It projects that will lower the segment’s availability rate from 6.8 percent to 5.4 percent by 2035.
Cushman & Wakefield’s AI Impact on Commercial Real Estate report (May 2026) adds a demand-side view. It projects AI-driven productivity will lift total U.S. commercial absorption by about 330 million square feet through 2035, including an additional 6.7 million square feet of retail. Consumer spending has held up, with U.S. retail sales up 6.7 percent year over year in June 2026, per Census data cited by CBRE.
For investors evaluating a growth market, the indicators below tend to precede retail development demand by two to five years:
- Residential permits and rooftops. Single-family and multifamily permits in a trade area signal the households that will shop there. The South and West’s 79 percent share of 2025 single-family starts shows where this pipeline is deepest.
- Grocery anchor activity. A grocer committing to a site validates the trade area and creates demand for the adjacent strip, pad sites, and service tenants.
- Employer announcements. A plant, campus, or headquarters relocation brings daytime population and wage growth that restaurants, medical offices, and personal services depend on.
- Road and utility projects. Highway interchanges, arterial widenings, and water and sewer extensions determine which parcels become developable next.
- School and healthcare expansion. New campuses and clinics track family formation and mark the edge of the growth path.
The states leading on these signals in 2026 are largely the same ones leading on output and population. That is why retail land in Texas, Florida, Arizona, and the Carolinas keeps drawing capital. The difference between a good state and a good site, however, is settled at the submarket level.
How Should Investors Evaluate Commercial Land in Growing States?
A state ranking identifies where to look. It does not identify what to buy. Within the same high-growth state, one corridor can be undersupplied while another is already overbuilt. The difference shows up in land pricing, absorption, and exit value. Investors who treat the fastest growing states 2026 as a filter rather than a thesis tend to underwrite more carefully.
A disciplined evaluation works through six questions in order:
- Is the parcel in the path of growth or behind it?
Compare the site’s position to the direction of new permits, school openings, and road projects. Land ahead of rooftops carries more timing risk and more upside; land behind them has demand in place but higher cost.
- What does the trade area actually need?
Count existing grocery, restaurant, medical, and service square footage within the drive time, then compare it to projected households. Growth alone does not create demand for a format that is already saturated.
- What are the entitlements, and what will they cost?
Zoning, platting, and site plan approvals often produce the largest single jump in land value, but they also take time and carry political risk. Securing entitlements early can turn raw acreage into a buildable, income-producing asset, provided the approval timeline and costs are underwritten carefully.
- Is infrastructure in place or funded?
Water, sewer, drainage, and road access are the difference between a buildable site and a long hold. Verify capacity with the municipality, not the listing.
- What is the land basis relative to the finished value?
Model the cost of entitled, improved land against achievable rents and cap rates for the intended product. A low purchase price in a fast-growing state can still be expensive if the finished center cannot support it.
- Who else is building, and when will they deliver?
Track competing projects within the trade area and their delivery dates. Oversupply in a single corridor can stall lease-up even when the metro as a whole is tight.
Blazing Hospitality applies this sequence to 15,000 to 20,000 square foot retail strip centers near anchor retailers and in the commercial reserves of master-planned communities, in high-growth submarkets nationwide. Overlooked location fundamentals, entitlement upside, and excess land can each add value to a parcel, which is why every site is worth underwriting on its own merits.
What Risks Come With Betting on a High-Growth State?
The biggest risk is assuming that 2021 to 2025 is the template for 2026 to 2036. The post-pandemic surge was driven by an unusual mix of remote work, interstate moves, and a spike in international migration. All three have already cooled.
- Migration volatility. Net international migration to the United States fell from 2.7 million to 1.3 million between 2024 and 2025, and every state recorded a decline, per the U.S. Census Bureau (March 2026). Domestic flows have also eased. Texas’s net gain from other states dropped from 222,154 in 2022 to 67,299 in 2025, as reported by The Texas Tribune from Census data (January 2026). Pew notes the Midwest recorded positive net domestic migration in 2025 for the first time in at least 15 years. Affordability is redirecting some movers.
- Affordability pressure. The average 30-year mortgage rate reached 7.40 percent in October 2026, its highest level since late 2024, according to Freddie Mac. Higher rates slow household formation and home sales, which delays the rooftops that retail depends on. Camoin Associates (2026) flags housing, water, and grid capacity as the growing pains most likely to slow Sun Belt momentum.
- Infrastructure constraints. Water supply in the Southwest, grid capacity in Texas and Arizona, and road congestion in fast-growing suburbs can cap how much development a corridor absorbs, regardless of demand.
- Localized oversupply. National retail availability is near historic lows, but that average hides submarkets where several centers deliver at once. A tight state does not protect an overbuilt interchange.
- A slower national economy. CBO projects 1.8 percent average growth from 2027 to 2036. Growth states will be competing for a smaller national increment than they did in the early 2020s.
- Concentration risk. States whose momentum rests on one megaproject or one industry, such as a single semiconductor cluster or energy prices, can reverse quickly if that anchor stalls.
None of these risks argues against growth states. They argue for underwriting each site on its own trade area, infrastructure, and competitive set. They also argue for holding periods and capital structures that can survive a slower decade than the last one.
Common Questions About Growth States and Commercial Land
Which of the fastest growing states 2026 has the strongest economy?
On cumulative real GDP growth from 2021 to 2025, Texas leads the fastest growing states 2026 at 19.5 percent, followed by New Mexico at 19.1 percent and Florida at 18.9 percent. The data is from the Bureau of Economic Analysis, compiled by Visual Capitalist (June 2026). On single-year 2025 real GDP growth, Florida and South Carolina tied for first at 3.1 percent. The answer depends on the metric and the time period.
Is population growth or GDP growth more important for retail demand?
Population and household growth matter more for neighborhood retail because they directly create shoppers. GDP growth matters for wages, consumer spending, and the employers that anchor daytime traffic. The strongest retail markets, such as Dallas, Phoenix, and Houston in CBRE’s 2026 midyear data, show both.
Will Texas economic growth continue through 2036?
Current projections say yes, but at a slower pace. Texas economic growth is expected to track the national slowdown, with the Dallas Fed forecasting 2026 job growth of 1.2 percent, below the state’s 2 percent long-run average. On population, the Weldon Cooper Center (July 2026) projects Texas growing from about 34.2 million residents in 2030 to 38.3 million in 2040, the largest numeric gain of any state. Projections assume recent trends continue and are not guarantees.
Why did growth slow in most states in 2025?
Net international migration fell by roughly half between 2024 and 2025, and domestic moves dropped to decade lows. Those findings come from Census Bureau estimates analyzed by Pew (May 2026). Growth slowed in 44 states as a result, though the South remained the fastest-growing region.
How far ahead of growth should a land investor buy?
Far enough that pricing has not fully adjusted, but close enough that infrastructure and entitlements are achievable within the hold period. Land two to five years ahead of rooftops, with funded utilities and a clear zoning path, generally balances timing risk and upside. Raw land with no utilities can take much longer to become developable.
Do fast-growing states guarantee a profitable commercial land investment?
No. State-level growth improves the odds, but returns are determined by trade-area demand, land basis, entitlement cost, infrastructure timing, competing supply, and interest rates. A well-located site in a moderate-growth state can outperform a poorly located one in a high-growth state.
Evaluate a Growth Market With Blazing Hospitality
State rankings change every year. The fundamentals of a good site do not: demand ahead of supply, infrastructure in place, entitlements secured, and a basis that leaves room for value. Blazing Hospitality works with capital partners, retail tenants, and landowners who want to see how the fastest growing states 2026 translate into specific retail land opportunities, and which signals to watch over the decade ahead.
To discuss a market or a parcel, schedule an introductory call, call or text (682) 285-1600, or email info@blazinghospitality.com.
Blazing Hospitality is a commercial real estate investment firm specializing in retail development and nationwide property investments, headquartered in Fort Worth, Texas, and led by Founder and CEO Smit Shah. Market data referenced from the Bureau of Economic Analysis, U.S. Census Bureau, Congressional Budget Office, Federal Reserve Bank of Dallas, The Pew Charitable Trusts, and the Weldon Cooper Center, 2025 to 2026.
Sources
| Source | Date | Used for |
| Visual Capitalist, Mapped: Which States Grew Fastest Since 2021 (BEA data) | June 2026 | Real GDP growth by state 2021 to 2025; Texas $372 billion; 2020 to 2025 population gains |
| The Pew Charitable Trusts, Most States’ Population Growth Slowed in 2025 | May 2026 | 2025 state growth rates; 15-year CAGR; 44 states slowed; natural change; Midwest migration |
| NAHB Eye on Housing, Population Growth Slows in 2025 (Census Vintage 2025) | February 2026 | Numeric state gains: Texas 391,243; Florida 196,980; North Carolina 145,907 |
| U.S. Census Bureau, net international migration story | March 2026 | Decline in net international migration in every state |
| Congressional Budget Office, Budget and Economic Outlook: 2026 to 2036 | February 2026 | 2.2 percent 2026 growth; 1.8 percent average 2027 to 2036 |
| Weldon Cooper Center, UVA, national and state population projections | July 2026 | 2030 and 2040 state projections; South share of population |
| Office of the Texas Governor, Texas Economy Hits Record $2.9 Trillion | April 2026 | Texas 2025 GDP and 2.5 percent real growth |
| Federal Reserve Bank of Dallas, Texas Employment Forecast | September 2026 | 2026 job growth forecast |
| U.S. Census Bureau, New Residential Construction | 2025 data | South and West share of single-family starts |
| Freddie Mac, Primary Mortgage Market Survey | October 2026 | 30-year mortgage rate |
| Camoin Associates, Top 10 States With the Highest Economic Momentum in 2026 | July 2026 | Momentum rankings; business applications; capital investment examples |
| CBRE, U.S. Real Estate Market Outlook Midyear Review 2026, Retail | 2026 | Availability, completions, absorption leaders, 2035 supply forecast |
| Cushman & Wakefield, AI Impact on Commercial Real Estate: The Next 10 Years | May 2026 | 330 million square feet; 6.7 million square feet retail |
| The Texas Tribune, Census: Texas led U.S. in population growth in 2025 | January 2026 | Texas domestic migration 2022 vs 2025 |